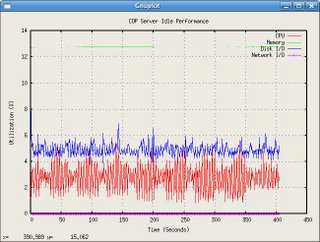
GNU Plot example

---------------------------------------------------------------
#!/usr/bin/gnuplot -persist
#set terminal png
set title "Idle"
set grid
set xlabel "Time (Seconds)"
set ylabel "Utilization (%)"
set autoscale
plot "data" using 2 title 'CPU' with lines, "data" using 3 title 'Memory' with filledcurves, "data" using 4 title 'Disk I/O' with lines, "data" using 5 title 'Network I/O' with linespoints
---------------------------------------------------------------
// excerpt from data file
11:29:37 2.97 12.81 5.44 0.02
11:29:52 2.17 12.80 4.68 0.01
11:30:07 2.70 12.80 6.15 0.01
11:30:22 3.93 12.80 5.65 0.01
11:30:37 3.23 12.80 5.31 0.02
11:30:52 2.23 12.80 4.72 0.01
11:31:07 1.87 12.79 4.96 0.01
11:31:22 2.93 12.80 4.18 0.01
11:31:37 3.77 12.80 5.17 0.02
11:31:52 2.53 12.80 4.64 0.01
11:32:07 2.00 12.79 4.86 0.01
11:32:22 2.77 12.80 4.18 0.01
0 Comments:
Post a Comment
<< Home